
Your OEE is probably averaged wrong
Averaging each machine's availability gives the wrong plant OEE, because a short job weighs as much as a long plan. Sum the hours, then divide.
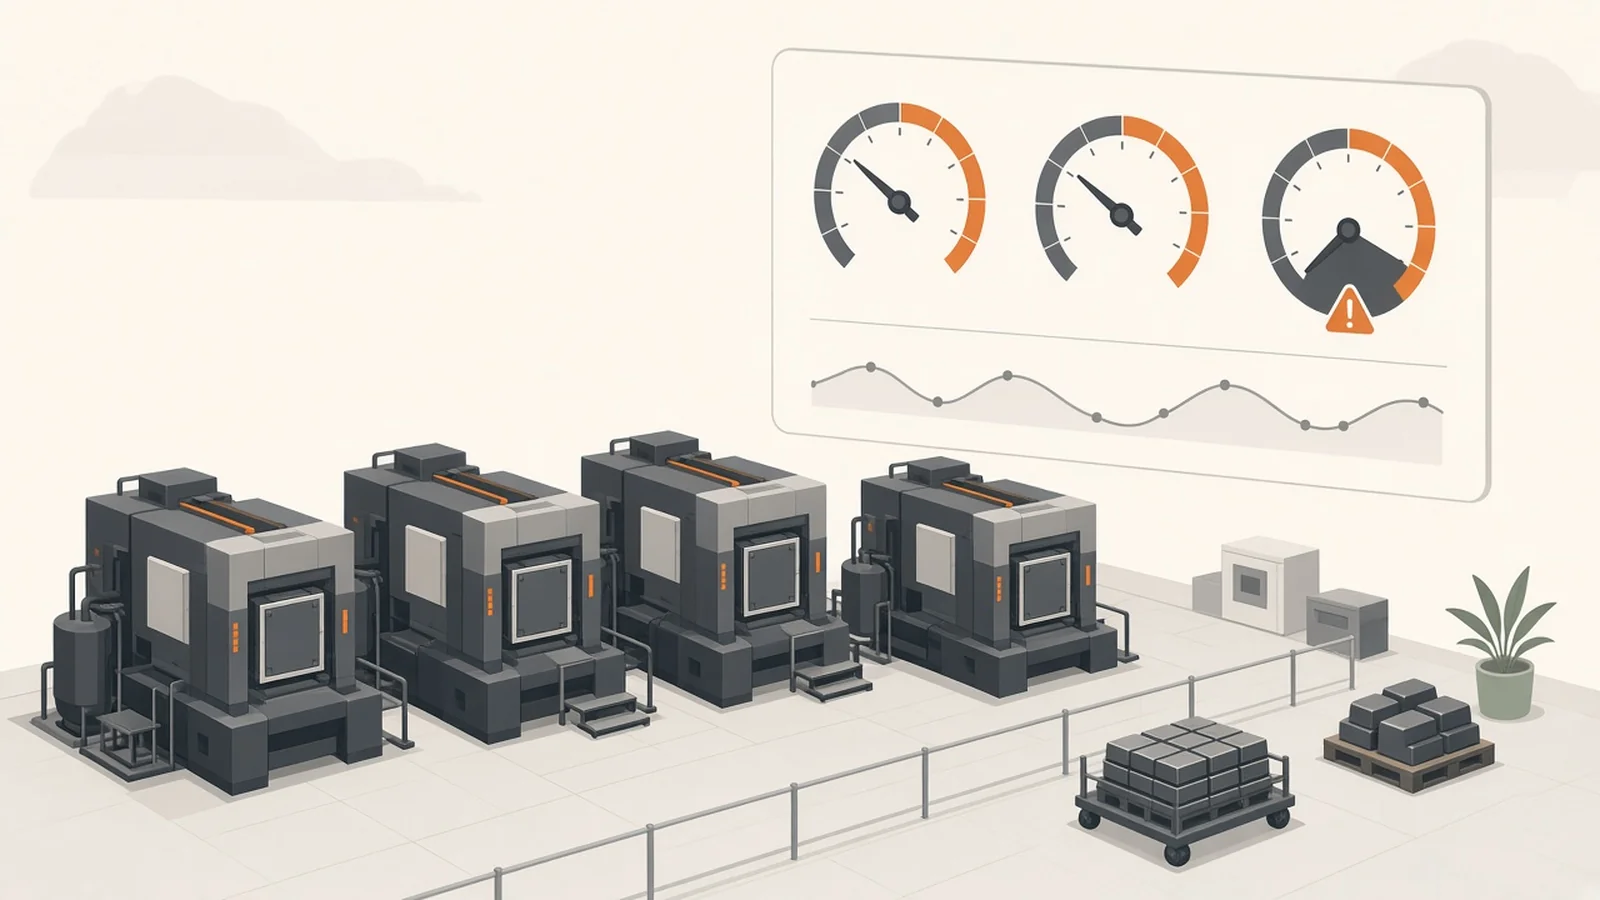
If you average the availability of each machine, the plant OEE is wrong. A short job weighs the same as a long plan, so the percentage comes out higher than the summed hours. We learned this building live OEE boards for a die-casting manufacturer, after the first version got the clock wrong.
A day that did not add up
Controllers reported over MQTT, master data sat in NocoDB, and the charts were Metabase on Postgres. There was more than one plant.
Their team checked one day in August 2026 against the source. Shifts were assigned. Availability came out negative anyway, and so did performance.
Downtime for that day came out to more than 24 hours. Split by machine, it missed the overall figure for the same filter, on every machine. Breakdowns were counted from 8 in the morning, not from midnight. The query assumed a shift filter. The dashboard was set to the whole day.
Parts disagreed too. One grid showed 390. The production trend for the same day showed 287. The source had 31 breakdowns. The dashboard had 35.
Cost of poor performance is the hour rate times downtime, plus excess load and unload. The rate was 250 per hour. The screen matched neither the downtime card nor the graph, and one figure never said whether it was minutes.
The clock, then the ratio
Availability is run time divided by planned time. We took run time as planned time minus downtime. Performance divides ideal production time by that same run time. Vorne’s OEE factors (opens in a new tab) define availability as run time over planned time, and performance as speed while the machine is running. Leave a breakdown unclipped and downtime can exceed the plan. The remainder goes negative, and both ratios go with it. The press did not run backwards.
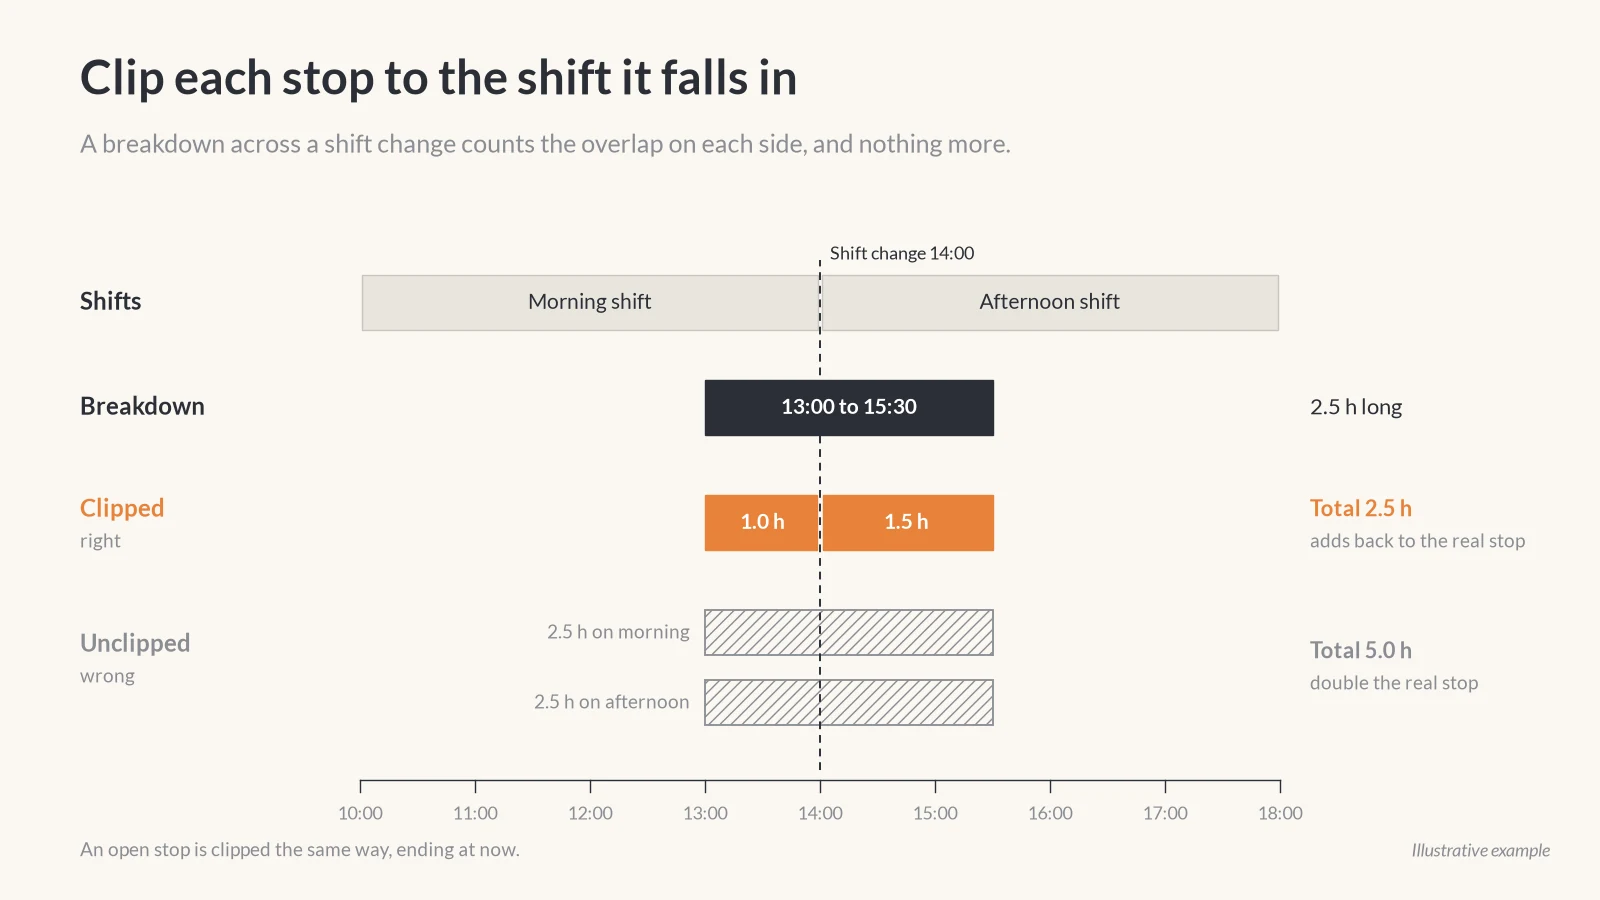
Downtime that counts for OEE is breakdown events only, clipped to the shift. A stop across a shift change counts the overlap on each side. An open stop counts up to now. Count the whole event on every shift it touches and the hours run past the length of the day. E-stops and idle time between cycles stay out. Book an e-stop as downtime and your OEE comes out lower than ours.
The 8am start was that window. The query assumed a shift filter, so the day opened at 8 and midnight to 8 never got in. On a plant that runs at night, those hours belong to a shift. We removed the shift filter. The date range is required and opens on the previous seven days. Plant and machine group are optional, and every shift defined for the plant is included.
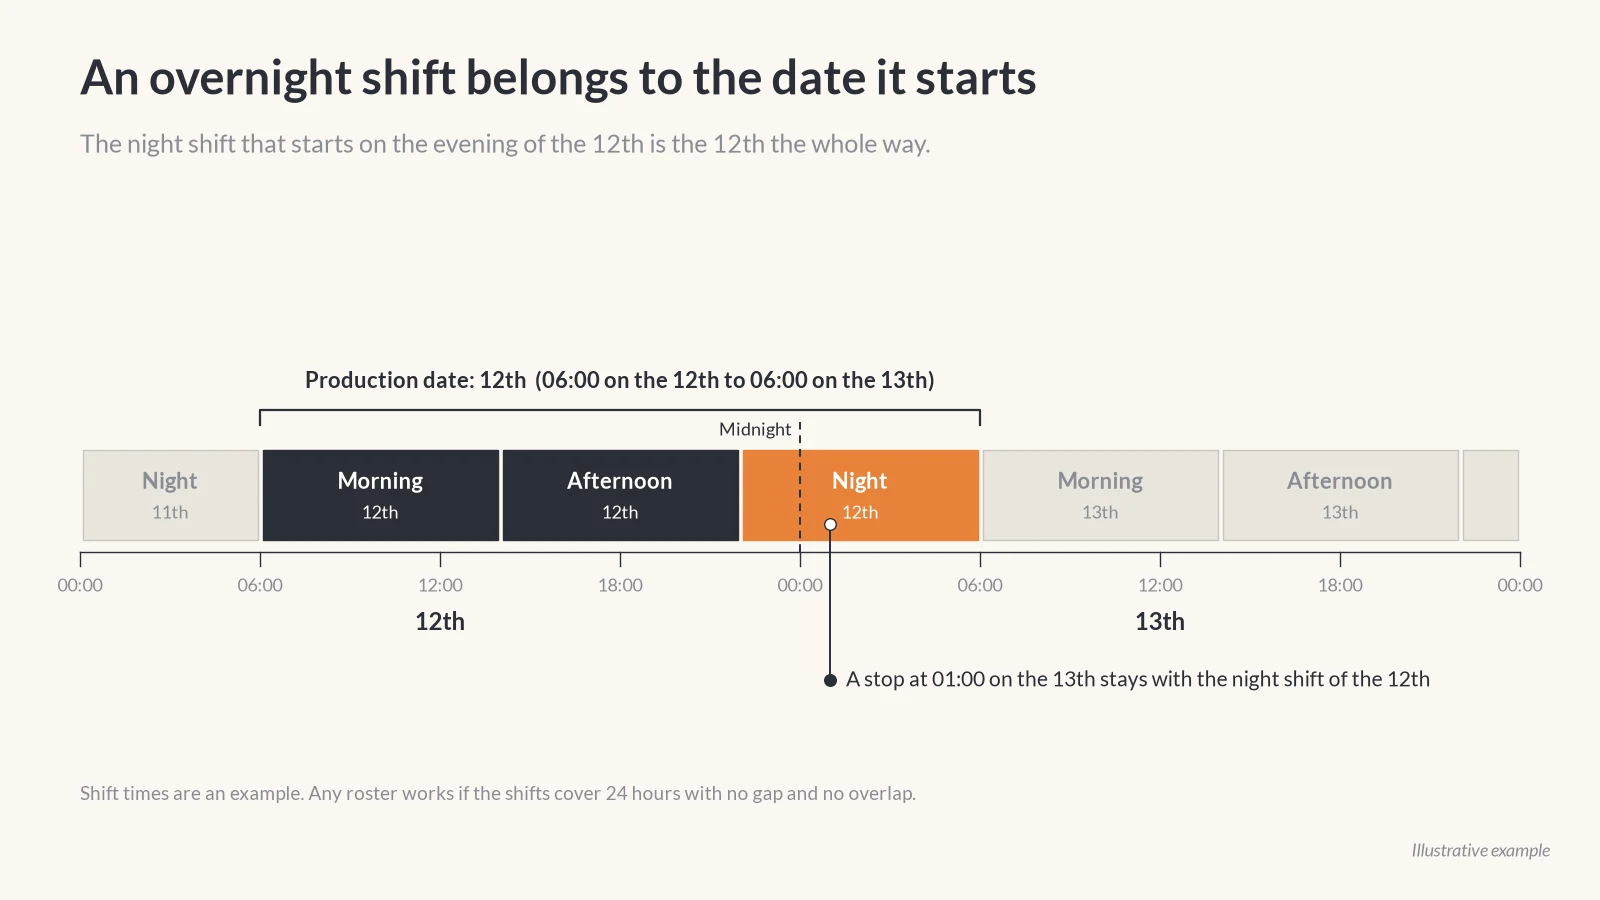
An overnight shift belongs to the date it starts. A shift that begins on the evening of the 12th and ends on the morning of the 13th is the 12th the whole way, and a stop at 1 in the morning stays with it. While the shift is running, the production date does not roll forward.
The current date counts only planned time already elapsed. A full day’s plan at 11 in the morning makes the morning look worse than the floor. Holidays and future dates are out. Breaks are rougher than the rest. We store a total, not the interval, and a shift still running loses that break in proportion to time elapsed. It is a little off until the shift ends.
Each plant needs a calendar row per date, or the day vanishes with no error. We backfilled them. Shifts have to cover 24 hours with no gap and no overlap, and break time has to be zero or more and shorter than the shift. If every machine misses the plant total, the window is wrong. One sensor does not do that.
Why the same day showed 390 and 287
390 and 287 are one day, and the gap is not rounding. A completed cycle that was not interrupted is assigned by its end time. A cycle missing a part, a standard cycle time, or a standard load and unload time is dropped from every production metric and counted aside as an ignored cycle. A calm OEE over a large ignored count is a smaller day than the shop ran.
Standards are read from the part record when the query runs. Inactive parts stay valid for old dates, but change a standard cycle time and past performance moves with it. A month you have already closed will not sit still.
31 breakdowns in the source, 35 on the dashboard. The review never pinned the four on one cause, and we will not invent one. They match only when the board uses the same dates and the same clipped events. Until then the dashboard is the number under test.
They asked for a view of excess load and unload, because it sat inside the cost and nowhere else. Time is seconds in the query and minutes on the screen, so the unit is chosen once.
Do not average the percentages
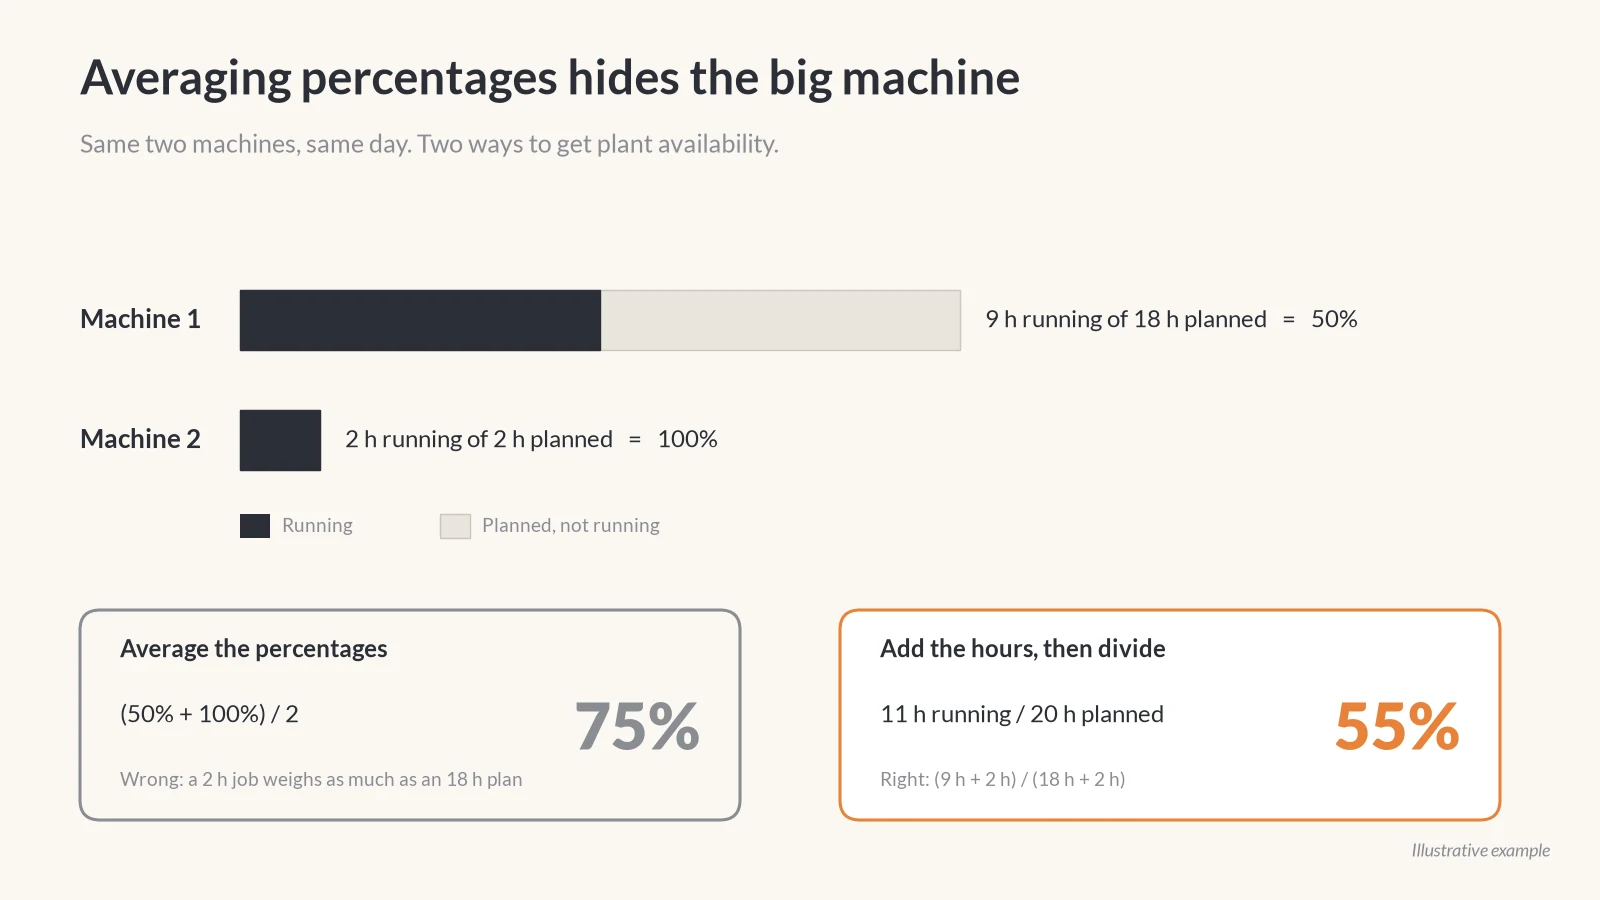
Plant OEE is not the average of the OEE on each machine, and plant availability is not the average of the availability column. Add the components, then divide. An average gives a two-hour job the same weight as a long plan.
The numbers in this section are an illustration, made up so the division is easy to redo by hand. They are not figures from the plant.
Machine 1: 18 hours planned, 9 running, availability 50%. Machine 2: 2 hours planned, 2 running, availability 100%. Average the percentages and you get 75%. Add the hours first and you get 11 running out of 20, which is 55%. Two good hours on the small machine hid a large one that ran half its plan. A short bad run on the small machine does the reverse, and pulls a healthy day down.
One row per production date and machine holds the pieces: planned seconds, downtime, run time, valid cycles, ignored cycles, parts, and ideal production seconds. Availability is run divided by planned. Performance is ideal divided by run. OEE multiplies the two by a quality factor. Vorne’s quality factor is a count of good parts. Ours is a number we configure. A week or a plant is the sums, with the division done again afterwards.
sum(run_seconds) / nullif(sum(planned_seconds), 0)A zero on the bottom is the only blank. Ratios are not capped at 100% and not rounded, so a loose standard can print over 100% and a bad window can still print negative. The negative availability in August was a signal, and it belonged on the board.
is_planned_production_day became is_holiday, which flips the meaning, so stored values had to be inverted. Miss a row and a working day drops out, or a holiday counts as production, with no error.
Check a number you already have
One plant, one date, the shift roster, a calculator.
- Add planned hours for every shift starting that date, including a night shift that runs into tomorrow. Leave out the shift that started yesterday.
- Machine downtimes should sum to the plant figure. A gap on every machine is a window problem.
- A breakdown after midnight belongs to the shift already running, often the previous date. A day that opens at 8 has lost it or filed it late.
- Before today’s shift ends, planned time is elapsed hours only. One break total makes the live shift approximate.
- A stop across a shift change should split into overlaps that add back to its real length. An open stop ends at now.
- Exact 100% availability down the page means you should ask if the ratio is capped.
- Ask for cycles ignored because the part or the standard time was missing. If that count is hidden, the OEE skipped part of the day.
- Rate times the card’s downtime, and rate times the graph’s, should be able to reach the cost. If they cannot, the unit or the excess load and unload hours differ.
- If plant OEE is an average of the machine percentages, ask for the summed hours and divide once.
When the hours do not add up, take the percentage out of the morning meeting and start from the hours. If your plant’s OEE numbers look off, tell us and we will look at how they’re calculated.